Visual Computing Research Presented in Denmark
Strong Presence of IC\M/T at Eurographics/IEEE Conference on Visualization (EuroVis) in Odense, Denmark
The EuroVis (European Conference on Visualization) is a top-class scientific conference with a focus on the topics of data visualisation and visual analytics. It is organised by the Eurographics Association and brings together researchers, experts, and practitioners of various disciplines in order to discuss the latest advancements, technologies, and applications in visualisation.
The conference encompasses lectures, poster presentations, workshops, and panels and provides a platform for the exchange of innovative ideas and the promotion of collaboration in the visualisation community.
Strong Scientific & Organisational Involvement
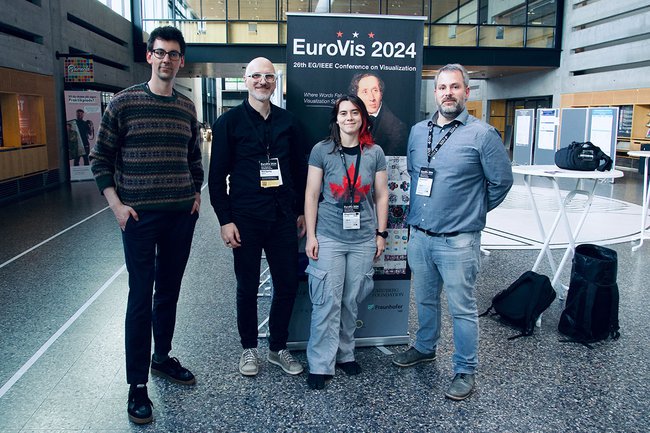
The research results of several scientists from our Institute of Creative\Media/Technologies were selected in a peer review procedure and presented in Odense, Denmark, from 27 to 31 May 2024.
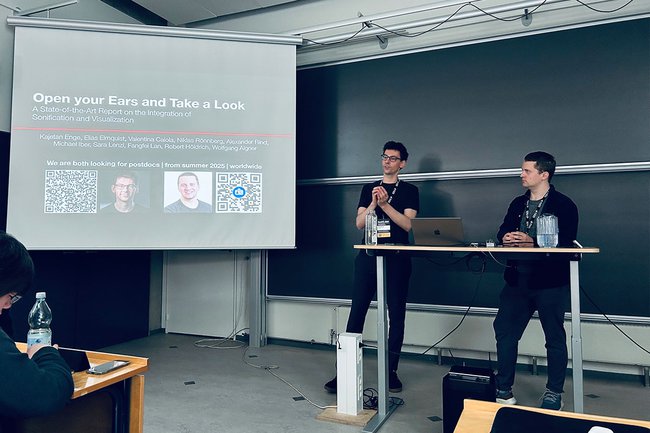
The showcased works included a state-of-the-art report on audiovisual analytics, a paper on visualisation competence in schools, a panel discussion with international line-up on the combination of sonification and visualisation, and contributions on data physicalisation, interaction, and visual analytics.

Copyright: St. Pölten UAS
The paper titled “cVIL: Class-Centric Visual Interactive Labeling” co-created by Matthias Zeppelzauer was honoured with the EuroVA Best Paper Award. Congratulations!
In addition to their scientific contributions, our researchers were involved in the organisation of the scientific programme as well: Wolfgang Aigner was Full Paper Chair, while Magdalena Boucher and Christina Stoiber were members of the programme committee for the Education Papers, Alexander Rind was in the programme committee for EuroVA, and Victor Schetinger contributed his expertise as reviewer.
Here you can find the six conference contributions of our nine researchers:
Boucher, M., Stoiber, C., Kejstová, M., Kandlhofer, M., Ertl, A., Kriglstein, S., & Aigner, W. (2024). Mapping the Landscape of Data Visualizations in Schools. EuroVis 2024 Education Papers
